ANALYSIS OF "CPU PITCH DIFFICULTY" SETTING
In this page we will explore the differences of the Pitch Difficulty setting. Hopefully this will help you determine which level is most suitable for your play style.
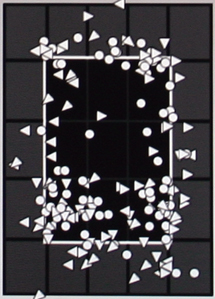
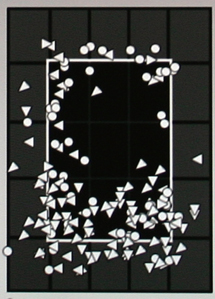
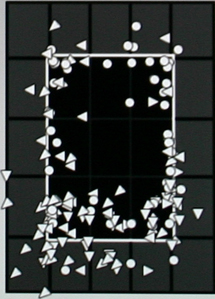
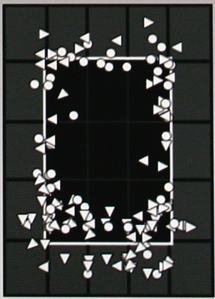
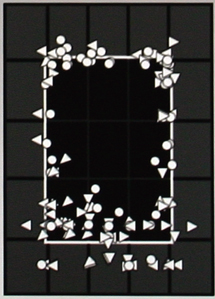
What I did was play one full game on every CPU Pitch Difficulty level using the same pitcher and batters. I didn't swing at any pitches, thus I always ended up with 27 strike outs in every game. After the games I noted the stats, took photos of the pitch location charts and compared them all side-by-side as shown below.
Due to the results of these tests I also want to talk a little about walks as well. I heard from a couple of new players they had a hard time drawing walks in the game. Our main translator and veteran PYS fan Muka has always sworn on his dog's life that walks are plentiful and realistic in this game. The results of these tests confirms he knows what he's talking about so his dog will live to see another day LOL.
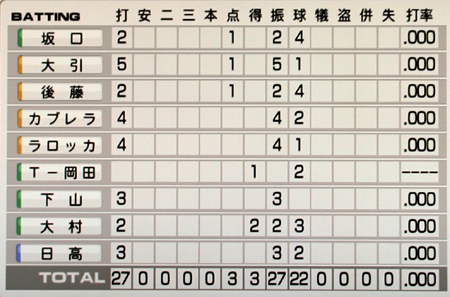
You most definately CAN draw walks! Look at the image below, it shows there was a total of 22 walks during one of the test games! Again, I didn't "work counts" or rattle pitchers with hits; my team just sat and took every pitch. This result came from the worst control rated starting pitcher and was definately an anomally but more on this result later.
 |
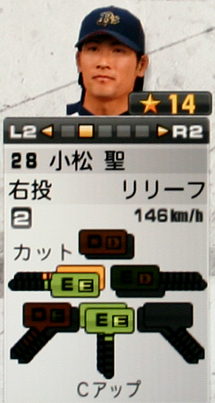 |
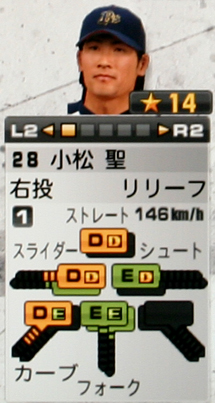
Our test subject is the Buffalos #28 Satoshi Komatsu who was 5-8 with a 4.77 ERA in 2010. He gives up alot of hits but has a good strike to ball ratio (2-1) and allowed 3 walks per 9 innings this year. As you can see all of his pitches and control are rated near average. His special abilities are:
*Note: All tests were performed with the pitcher's condition set at neutral (yellow) face. |
 |
 |
 |
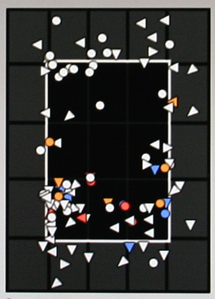
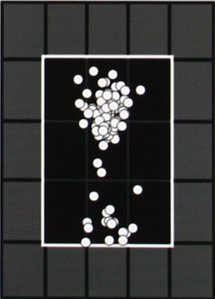
VERY EASY:This is basically batting practice as nothing but fastballs were thrown. The CPU was AWOL too with the game ending tied 0-0 after 12 innings. All 17 missed releases stayed in the zone, they just ended up low middle.111 Pitches |
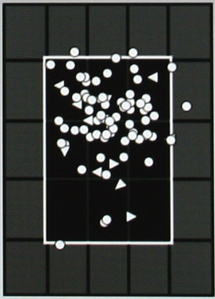
EASY:Things are spreading out a bit but you wont get any walks. A few balls were thrown but it's still mostly fastballs & strikes. 88 Pitches |
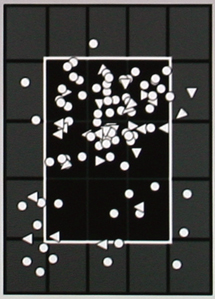
NORMAL:Not sure why this is considered normal level since the average user should crush these balls. You're not going to get any walks on this level either and there are still too many fastballs. 108 Pitches |
 |
 |
 |
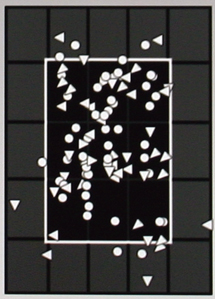
NORMAL PLUS:Fastball % is now where it should be for this pitcher who has alot of breaking stuff in his repertoire. Walks will still be almost impossible and is pretty much the last time you're going to see pitches falling dead center. 99 Pitches |
HARD MINUS:This spread is probably the closest to representing the pitchers true control ratings. It has some East/West misses which is absent in the higher levels. Overall a nice mix of good & bad pitches with 9 total walks. The only negative may be the low BP%. This one had the lowest overall strike percentage of them all. 126 Pitches KOMATSU + RELIEVERS COMBINED: 181 Pitches
|
HARD:Pretty similiar to Hard Minus but with double the BP%. This game ended up with 2 runs scored in the 9th as Buffalos Katoh came in and fell apart; issuing 4 walks and 1 wild pitch. No pitches came in dead center though so overall I prefer the "wilder" Hard Minus spread. 110 Pitches KOMATSU + RELIEVERS COMBINED: 173 Pitches
|
 |
 |
 |
HARD PLUS:Increase in strike % but there were still plenty of walks. BP% rose significantly and this is where the East/West pitches start sticking to the borders. One run was allowed in 9th by Katoh who once again issued 4 walks. 123 Pitches KOMATSU + RELIEVERS COMBINED: 155 Pitches
|
PERFECT:The top 2/3 of the strike zone looks pretty empty so I'd prefer to see a few more in that area and the middle. I'd also like to see more East/West misses. Note the strike % doesn't rise which is good so you can still get walks. 118 Pitches KOMATSU + RELIEVERS COMBINED: 152 Pitches |
SPIRITS:Good luck with this one because there will be nothing to hit up in the strike zone. Also, the super high BP% is brutal. Good to see the strike % stay below 60% so walks are still possible. 119 Pitches KOMATSU + RELIEVERS COMBINED: 146 Pitches
|
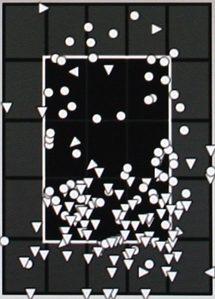
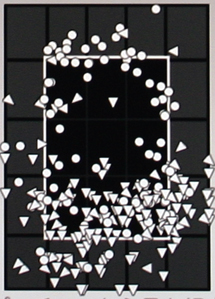
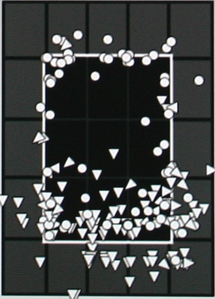
RESULTS OF STARTING PITCHER WITH THE WORST CONTROL:
 |
 |
 |
ARAKAKI HARD MINUS:The Hawks #18 Nagisa Arakaki probably has the worst control of all starting pitchers in the league. He has 'G' rated control ratings on nearly all of his pitches. As you can see he threw alot of good pitches to hit along with a good amount of wild pitches. 124 Pitches ARAKAKI + RELEIVERS COMBINED: 165 Pitches |
ARAKAKI HARD:22 WALKS! Arakaki had a terrible game, lasting 3 2/3 innings, 11 walks and 1 run allowed. With an amazing 22 walks combined I expected to see balls all over the place. However, the spread isn't a total mess which tells me alot of the balls/walks were on pitches that just missed the edges. 3 runs total were allowed in this game. 108 Pitches ARAKAKI + RELIEVERS COMBINED: 244 Pitches |
ARAKAKI SPIRITS:One run was allowed by Arakaki in this one. The high pitches stayed around the borders but this is about as bad as you're going to see in Spirits. 123 Pitches ARAKAKI + RELIEVERS COMBINED: 197 Pitches |
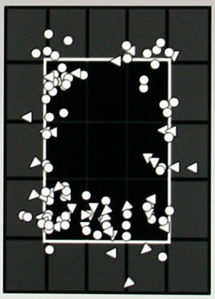
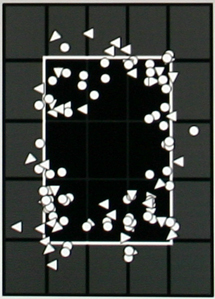
RESULTS OF STARTING PITCHER WITH THE BEST CONTROL:
 |
 |
MAEDA HARD MINUS:The Carps #18 Maeda has the best overall control I could find with starting pitchers. His top 3 pitches are rated A,B,B in control and the rest of his pitches have "C" rated control. As you can see he can slice the corners really well, this one looks like a higher level spread. NEW: 123 Pitches
|
MAEDA HARD:I didn't include a Spirits image because I don't really think it's necessary. Control ratings really mean something in this game. You are obviously going to struggle getting walks with this pitcher. 116 Pitches |
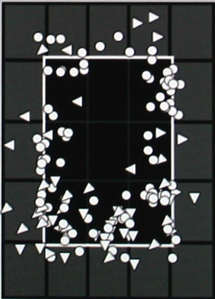
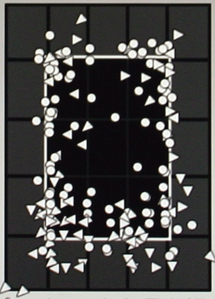
RESULTS OF STARTING PITCHER WITH GREAT STUFF BUT AVERAGE CONTROL:
 |
 |
DARVISH HARD MINUS:Many regard 'The Fighters' Darvish one of the best pitchers in the game; he has an 'A' rated fastball with 'C' control. His control ratings fell off though on the rest of his pitches according to the last 2010 (3rd patch) from Konami. Other than his fastball, the rest of his pitches are mostly rated E or F so you can get walks off Darvish. Overall a challenging spread but there are some good ones to hit. 147 Pitches |
DARVISH HARD:Wow, Darvish gave up 9 walks with barely over 50% of his pitches falling for strikes. If he isn't locating his fastball you can definately take advantage - there were plenty of good pitches to hit in this one. 148 Pitches DARVISH + RELIEVERS COMBINED: 179 Pitches |
PUTTING IT ALL TOGETHER:
|
Armed with all of this knowledge I wanted to see how many walks I could generate playing a normal game. My focus was to work counts, be patient and only swing at meaty pitches. I chose our test subject Komatsu mentioned above and here are his results:
So there you have it, walks are definately possible! After this game I felt if I had a more aggressive approach I probably would've ended up with around 2 walks - perfectly realistic for this pitcher in 5 innings of work. My strikeouts were a bit high because I took every 3-2 count, so you can't just sit and get walks all day or you will get burned. |
|
TIPS ON HOW TO GET WALKS:
Before you even take on a pitcher you should get an idea in your head if it's even worth trying to work counts and earn walks. There are just some pitchers out there you'll have to swing away at no matter what. If you look at their stats anything above 1.5 to 1 strike to ball ratio will be a tough one to get walks on. Here are some other suggestions... 1. On lower to mid-range levels 'Best Pitch' percentages will be lower. This means the 'Batting Point' will appear larger which can give you the illusion a ball is actually a strike. In other words if you see a large ball your eyes widen and you want to smack it out of the park. Be patient and get a better look, because those big balls around the edges might just be a ball. 2. Pay attention to special abilities. Is the pitcher a slow starter? Does he get rattled with runners on base etc? 3. Pitchers have a tendency to nibble in certain situations such as with the bases loaded or pitching against sluggers. You can earn walks in these situations. 4. Check out the "Stuff" ratings of your opposing pitcher and figure out what his top 3 pitches are. Then check the control ratings for each of them. If they are all "D" or below you can work counts. 5. Check out the condition of the pitcher - sad face / happy face etc. 6. It is probably impossible to draw walks on the first 4 levels. It may also be difficult if you choose a mid-range difficulty with a low pitch speed and it is easy to understand why. If the CPU is throwing big meatballs in the strike zone and you have all day to hit it with a low pitch speed, the user will always be successful in making contact and putting the ball in play. Therefore, if you choose a mid-range level you should consider increasing pitch speed which forces you to use a more realistic approach at the plate. |
ANALYSIS OF GAME CONDITION:All of the tests above were completed with the pitcher in condition yellow (neutral) face. I wanted to see how condition effects performance so I ran a test of 14 games - 7 with RED happy face and 7 with BLUE sad face. The tests were performed the same as the rest above - with the pitcher (CPU) throwing against my team which did not swing at any pitches. I used two pitchers - Komatsu and Ono of the Marines. TOTAL PITCHES THROWN DURING TESTS: 1852 AVG INNINGS PITCHED PER GAME: RED condition pitched an average of 1.3 more innings per game. Once the stamina bar was depleted BLUE condition didn't last too long. However, RED pitchers could carry on, in one case throwing 150 pitches. Every pitcher was taken out via injury (throwing too many pitches.) Blue lasted on average 129 pitches and RED 136 pitches before injury. Not sure in pennant mode if this is a good idea to put that much stress on the arm? FASTBALL%: RED condition threw 5% more fastballs but not sure why. This is why I added Ono to the test (because he has a G rated fastball.) Komatsu used the fastball more but Ono only slightly. STRIKE%: RED condition threw 58% for strikes, BLUE 53%. BB/9: RED allowed 4 walks per 9 innings. BLUE allowed 5.8 Best Pitch % and "Misses" didn't seem effected. Pitches thrown straight down the middle zone didn't seem any different. * Also note there may possibly be other factors at work with condition such as increase or decrease in power off the bat etc. This has not yet been tested and we don't know the "under the hood" calculations the game uses. Looking at these results though it's clear condition plays an important part in a game. |
CONCLUSION:
Higher levels dont seem to effect ball-to-strike ratio. Instead, balls thrown both outside and inside the zone will be located closer to the strike zone borders. Not counting beginner levels, only two full games had an overall strike percentage of 60% or more (both being the Maeda games.) Most ranged between 50-60% which is realistic. The average MLB pitcher throws 62% strikes, but keep in mind that number includes thrown balls which were swung on for strikes. Actual strikes thrown would most likely be somewhere in the high 50's. There was a study done in 2009 which showed 59% of all 3-2 pitches were thrown inside the strike zone. A total of 7 runs were scored by my "non-swinging" team over the course of 16 games. So occassionally pitchers WILL fall apart. Personally, I'd like to see some more pitches fall dead center along with a wider "shotgun" pattern overall. However, real-life players don't have a "Batting Point" to look at, so I'm not so sure the devs can pull that off without making the game too easy. There has to be some challenge to reading balls/strikes and hitting pitches in the zone, so I think it has a good balance as is. Perhaps they could program a wider variety with 'Batting Point' turned off? "A" control rated pitches should range between 65-70% strikes. Pitching results against poor batting teams doesn't seem to make a difference. I played a game with Komatsu vs The Swallows with DH OFF. He threw 54% of his pitches for strikes and allowed 5 walks in 6 innings. |


